The U.S. Senate has confirmed Kevin Warsh as the next Chair of the Federal Reserve, marking one of the most closely watched leadership changes at the central bank in decades.
The confirmation came through a tight 54–45 vote, the narrowest margin ever for a Fed Chair. That alone highlights how politically charged this transition is, and why there is heightened focus on the Fed’s independence going forward.
While the policy implications will take time to unfold, history offers a useful framework for understanding how markets tend to behave during such transitions.
What History Says About Market Behavior
Looking at prior Fed Chair transitions, equity markets have followed a fairly consistent pattern.
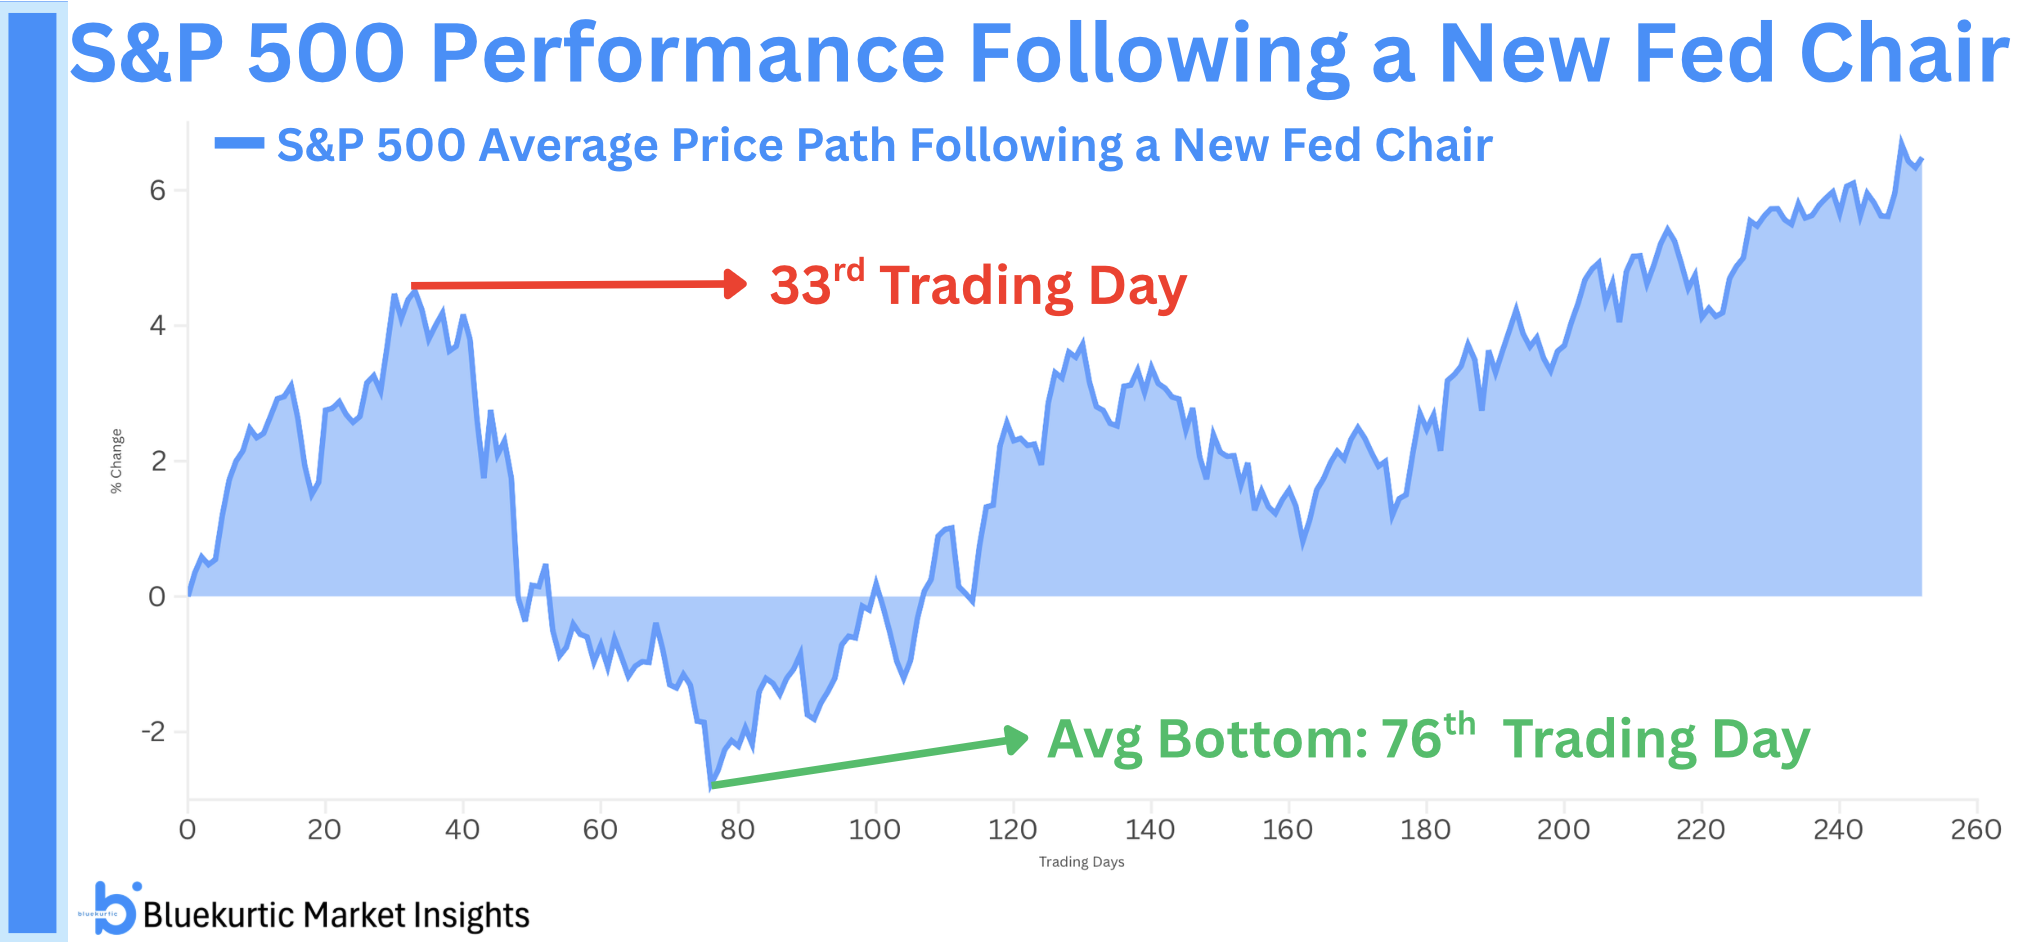
On average, the S&P 500 tends to peak around the 33rd trading day after a new Chair takes office. This is often followed by a period of weakness, with the market typically finding a bottom near the 76th trading day.
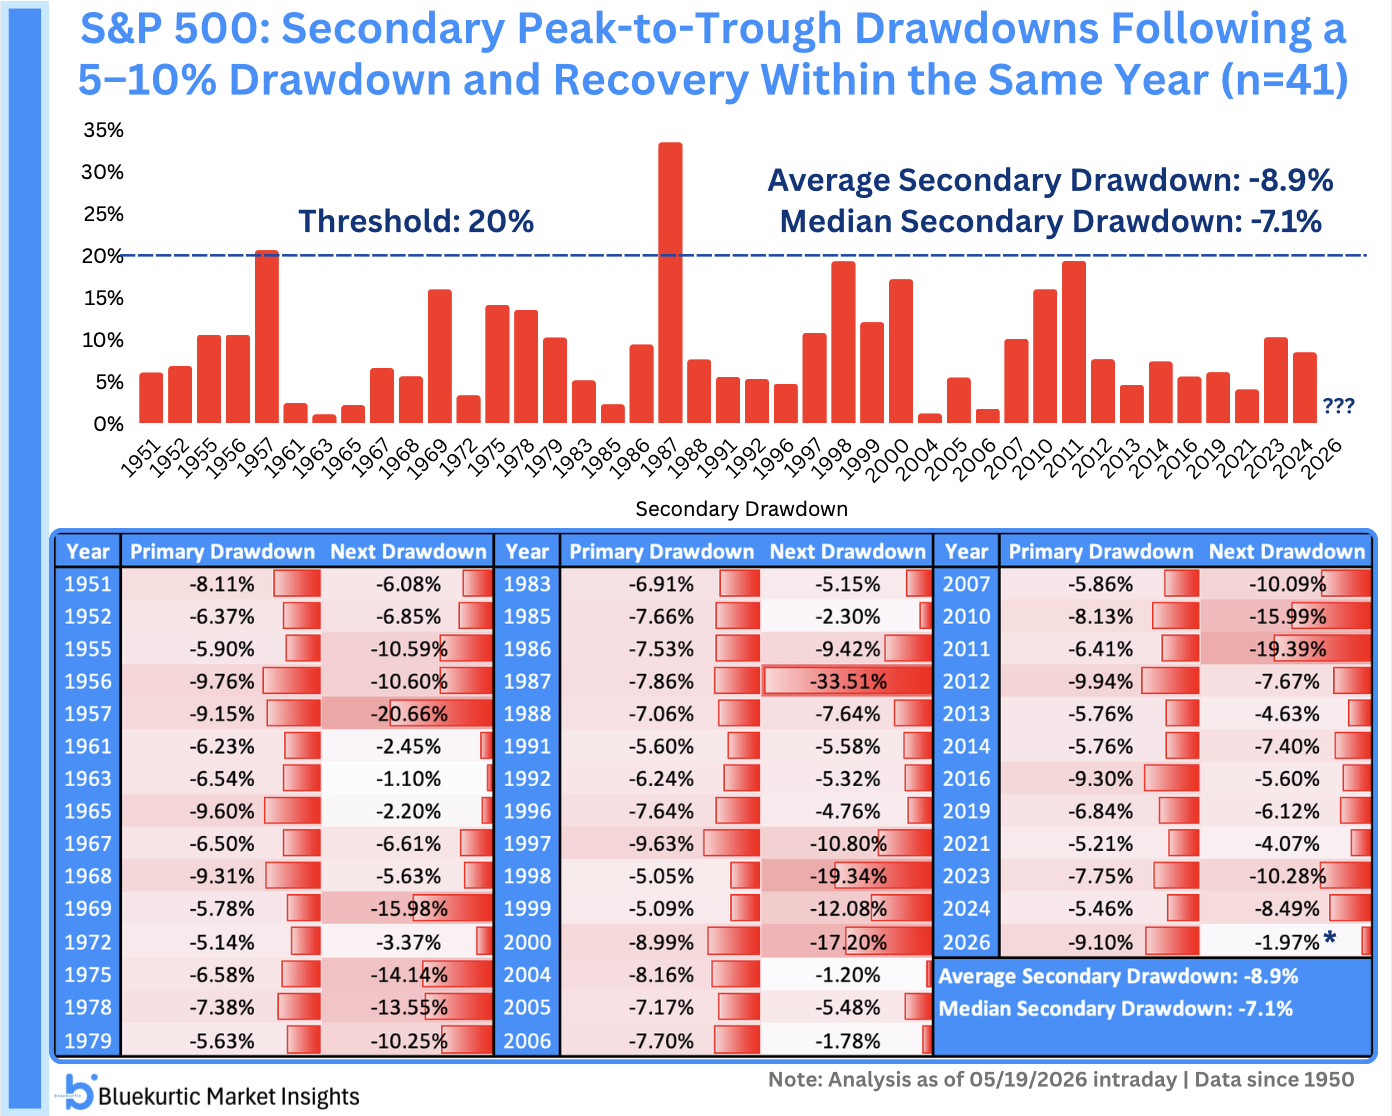
Despite this interim volatility, the magnitude of drawdowns has historically been limited.
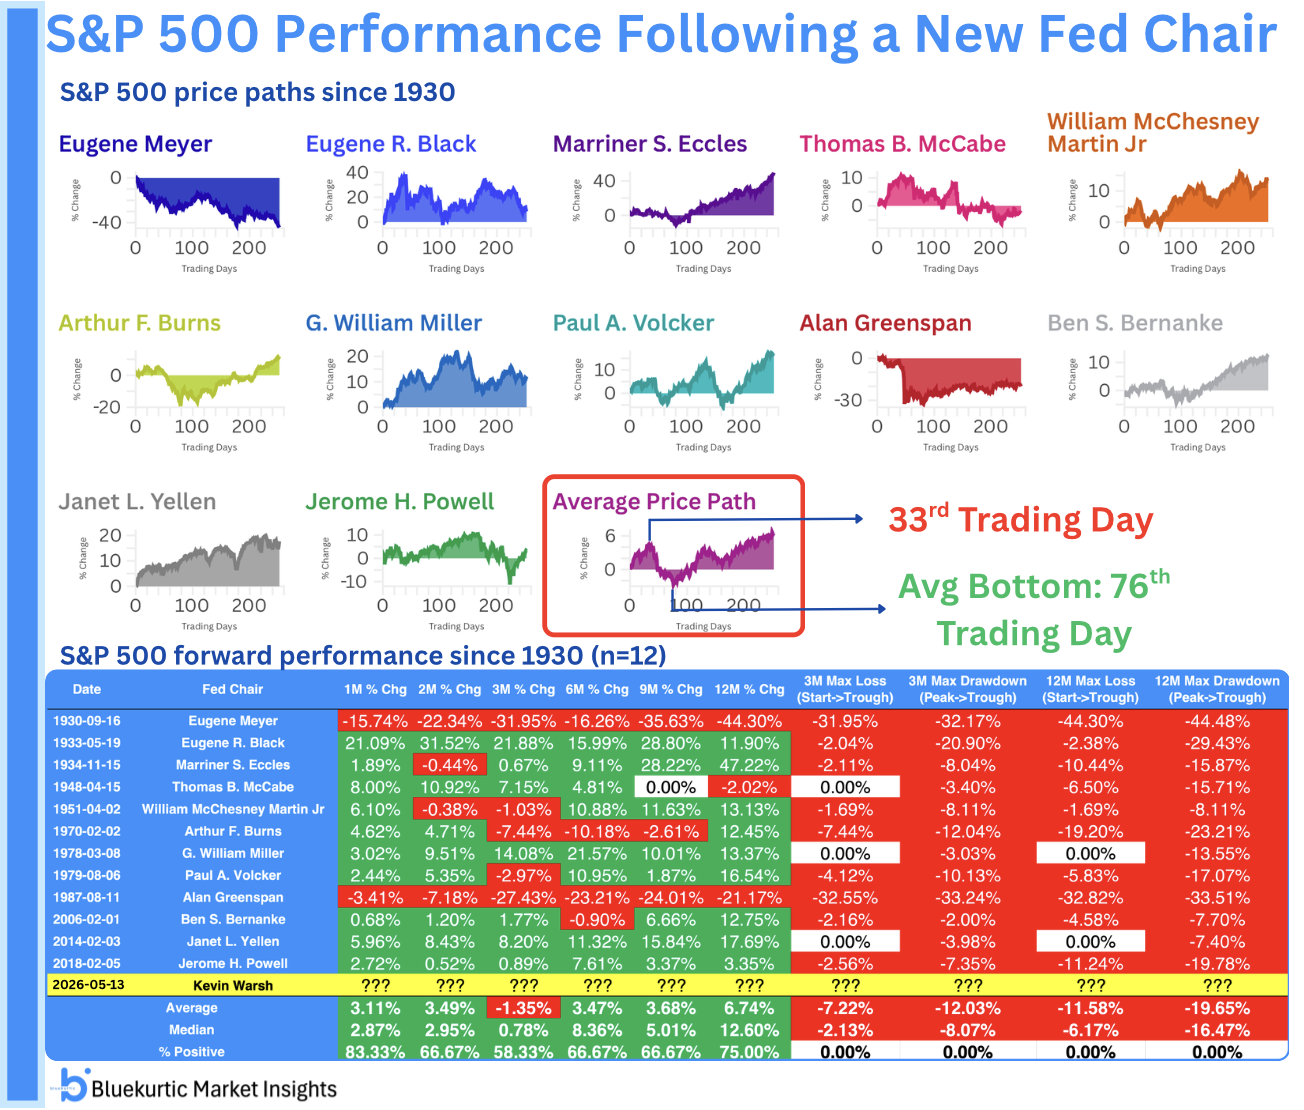 Across past cycles, the 3-month median maximum drawdown has been just 2.13%. That’s a remarkably shallow decline, especially considering the uncertainty that usually surrounds a leadership change at the Fed.
Short-Term Volatility, But Controlled Risk
The second chart simplifies this pattern by focusing on the average price path.
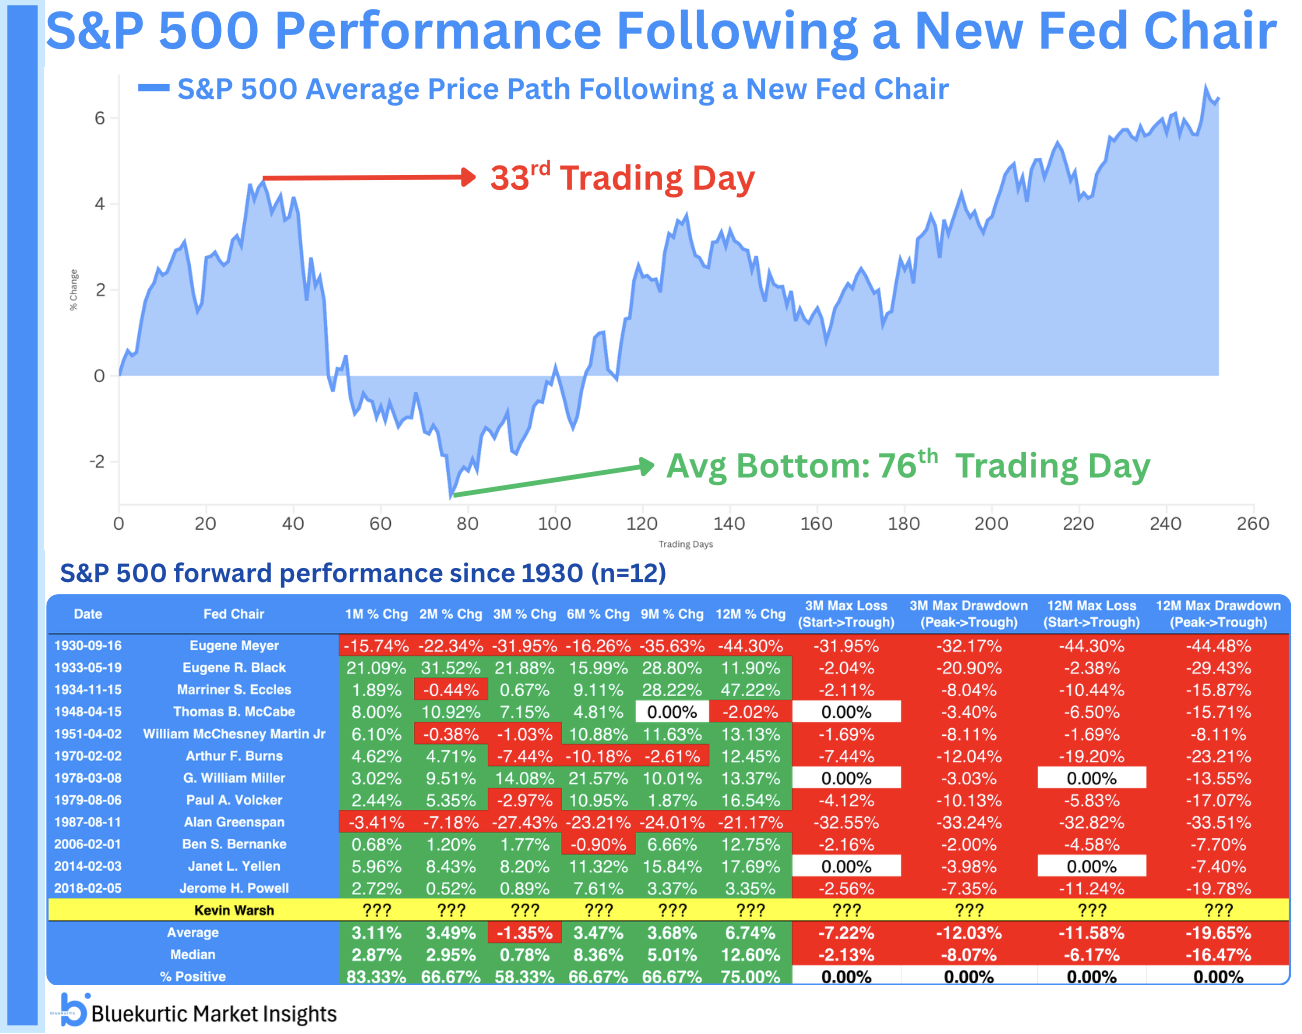
You can clearly see the tendency for an early rally, followed by a pullback phase, and then stabilization.
This aligns well with the idea that markets initially react to expectations and positioning, before reassessing policy direction as more clarity emerges.
What This Means Going Forward
The combination of a historically tight confirmation vote and a new Fed Chair naturally raises questions about volatility ahead.
However, the data suggests a more nuanced takeaway:
- Yes, volatility may increase in the near term
- But deeper drawdowns have not been typical in past transitions
In fact, the relatively small historical drawdowns support the view that major downside risks tend to be contained, even during periods of policy uncertainty.
Bottom Line
Kevin Warsh’s confirmation sets the stage for an important shift in U.S. monetary policy leadership. The 54–45 voteunderscores just how divided the backdrop is.
But if history is any guide, markets may follow a familiar script—early strength, a mid-phase pullback, and ultimately limited downside risk.
For investors, that suggests staying focused on the broader trend rather than overreacting to short-term volatility.